ICU Physiology in 1000 Words: The Folly of Pulmonary Vascular Resistance
By Jon-Emile S. Kenny [@heart_lung]
When interpreting hemodynamic studies of drugs which – potentially – alter the resistance of the pulmonary vascular tree, we often turn to the calculated pulmonary vascular resistance [cPVR] as our guide. For instance, a vasopressor determined to increase the cPVR is wholly avoided in a patient with pulmonary arterial hypertension. We envision the vascular conduits of the lungs crushed under pharmacological assault – blood vessels pinched and puckered like one’s lips biting into tart citrus. Conversely, a drug noted to lower the cPVR is championed for those with truly high impedance to blood flow through the lungs. Under the influence of this drug, we envision the vascular conduits of the lungs liberated – pulmonary blood vessels yawning wide, singing their praise in a soft chorus of hemodynamic hallelujah. But is this calculated variable telling us – specifically – what is happening within the pulmonary vascular bed? Is there a mechanistic link between this derived variable and the physiological forces operating between the right ventricle and left atrium?
The Calculated Pulmonary Vascular Resistance
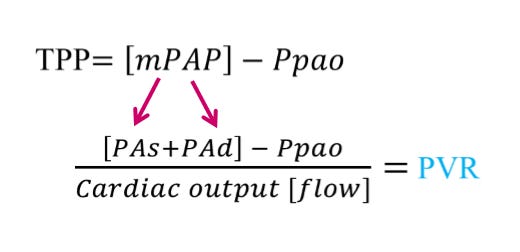
The cPVR is composed of 4 measured variables from a pulmonary artery catheter [PAC]. The pulmonary artery systolic pressure [PAs] and pulmonary artery diastolic pressure [PAd] determine the mean pulmonary artery pressure [mPAP]. One may consider the mPAP as the ‘pressure head’ for blood flow through the lungs. The pulmonary artery occlusion pressure [Ppao] – oft referred to as the ‘wedge pressure’ – may be thought of as the ‘pressure sink’ or down-stream pressure for pulmonary blood flow. The difference between the mPAP and the Ppao is referred to as the ‘transpulmonary pressure’ [TPP] and this gradient forms the numerator of the cPVR. The denominator of the cPVR is blood flow through the lungs, which at steady state should be equal to total cardiac output; blood flow is typically determined by thermodilution.
Figure: TPP is transpulmonary pressure which is composed of the mean pulmonary artery pressure [mPAP] and pulmonary artery occlusion pressure [Ppao]. The mPAP is determined by the pulmonary artery systolic pressure [PAs] and PA diastolic pressure [PAd]. Dividing the TPP by the cardiac output gives the calculated pulmonary vascular resistance [cPVR].
The Pulmonary Vascular Resistance is a Meaningless Variable
The misuse and misunderstanding of the PVR was described at least 30 years ago [1], reconsidered over 10 years ago [2] and elegantly demystified in this recent physiological treatise [3]. To appreciate why this provocative claim has been raised, consider how the cPVR changes in the two following thought experiments.
In thought experiment 1, below, contemplate slowly cross-clamping the left main pulmonary artery and consider what the PAC ‘sees.’ There will be an increase in all of: the PAs, PAd and therefore the mPAP. Importantly, the numerator [TPP] rises and there is a gradual fall in cardiac output. Consequently, the cPVR is increased and this experiment will be referred to as a ‘true’ increase in pulmonary vascular resistance because the pathophysiology actually lies within the pulmonary tree. This is somewhat akin to an acute PE.
Thought Experiment 1: Partially cross-clamping the left main pulmonary artery results in the pulmonary artery catheter [PAC, yellow] 'seeing' a higher PAs and PAd. This increases the TPP, reduces blood flow and, therefore, increases the cPVR; a clinical example here might be an acute PE.
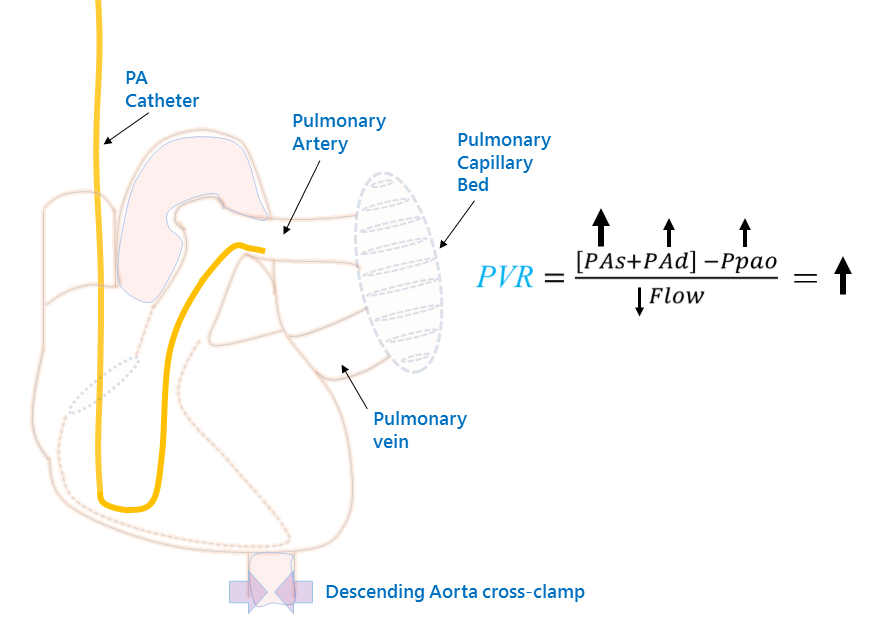
In thought experiment 2, consider slowly cross-clamping the descending aorta, just below the diaphragm. Now what does the PAC ‘see’? Here, the left ventricular outflow is impaired, so the Ppao and, therefore, pulmonary venous pressure is increased. This results in a recruitment and dilation of the pulmonary vascular bed [i.e. why one sees ‘cephalization’ on a CXR].
Now, the pulmonary blood vessels become maximally distended – to their elastic limits; in other words, the pulmonary blood vessels are stiff [4] [high elastance, low compliance]. Consequently, when the right ventricle ejects blood into the pulmonary arteries, the PAs increases disproportionately owing to a stroke volume being thrown against tense blood vessels. This is akin to why the peak pressure on a ventilator rises when the lungs are stiff – an incredibly salient point and the basis of this entire post. While the pulmonary tree is dilated [and therefore resistance is low], it is simultaneously stiff and this disproportionately increases the mPAP to the Ppao – the pressure gradient across the pulmonary bed rises and blood flow falls. The cPVR rises, but the pathophysiology lies entirely outside of the thorax. This is an ‘apparent’ increase in PVR – lowering the LV afterload [i.e. unclamping the aorta] will lower the calculated PVR without any direct effect on the pulmonary vascular bed. Thought experiment 2 is clinically similar to acute left ventricular heart failure.
Thought Experiment 2: Partially cross-clamping the descending aorta results in high Ppao, pulmonary venous pressure and the pulmonary vasculature recruits, distends and becomes more stiff. Now, the PAC 'sees' a higher PAs as blood is ejected into a poorly compliant vascular bed. While this [like thought experiment 1] increases the TPP, the Ppao and PAd rise in tandem, preserving the PAd - Ppao difference. Note that the cPVR rises - just as much as in thought experiment 1, yet the locus of pathology is entirely different! A clinical example here might be acute systolic heart failure with flash pulmonary edema.
How do we distinguish a difference between physiology 1 and physiology 2? The answer lies in the PAd – Ppao difference [3, 5]. In example 2 [e.g. WHO II pulmonary hypertension], the PAd – Ppao difference will remain small – the PAd and Ppao will rise together; the difference is normally less than 6 mmHg. In example 1 [e.g. WHO I pulmonary hypertension], the PAd rises much more than the Ppao.
Implications for Practice
It should be clear from the aforementioned, that it is not adequate to imply mechanisms from the cPVR alone, especially with respect to the pulmonary vascular tree. Noting an increase in the cPVR in response to an intervention should be followed with an inquiry into why the cPVR increased. Was it driven by a change in the pressure gradient [numerator] and if so, how? Did the PAd increase with respect to the Ppao [i.e. a true increase in resistance – thought experiment 1], or did the transpulmonary gradient rise solely because of increased PAs with preserved PAd-Ppao gradient [i.e. an apparent increase in resistance – thought experiment 2].
Consider a study which seeks to determine if a drug [e.g. phenylephrine] increases PVR. Should the study only report the cPVR, we are physiologically unable to precisely distinguish the effects of phenylephrine on the pulmonary tree unless we know the PAd – Ppao gradient. Perhaps this drug is causing thought experiment 2 physiology?
Conversely, consider a study which seeks to determine if a drug [e.g. a phosphodiesterase inhibitor] reduces PVR. Should the study only report cPVR, we are physiologically unable to determine if this drug is specifically reducing resistance within the thorax. Perhaps solely LV afterload was reduced [e.g. aortic cross-clamp removed] such that the pulmonary vascular tree was decongested and the apparent reduction in PVR was just that – apparent.
In conclusion, the cPVR is not meaningless, but it is certainly confounded. Avoid folly, be clear in your approach – demand the PAd-Ppao!
Happy Birthday Julia,
References
Versprille, A., Pulmonary vascular resistance. A meaningless variable. Intensive Care Med, 1984. 10(2): p. 51-3.
Naeije, R., Pulmonary vascular resistance. A meaningless variable? Intensive Care Med, 2003. 29(4): p. 526-9.
Naeije, R., et al., The transpulmonary pressure gradient for the diagnosis of pulmonary vascular disease. Eur Respir J, 2013. 41(1): p. 217-23.
Giuntini, C., A. Maseri, and R. Bianchi, Pulmonary vascular distensibility and lung compliance as modified by dextran infusion and subsequent atropine injection in normal subjects. J Clin Invest, 1966. 45(11): p. 1770-89.
Naeije, R., Physiology of the pulmonary circulation and the right heart. Curr Hypertens Rep, 2013. 15(6): p. 623-31.


