ICU Physiology in 1000 Words: Hidden Hemodynamics in Respiratory Mechanics
Jon-Emile S. Kenny MD [@heart_lung]
Hemodynamic assessment, by any means, demands a shrewd familiarity with mechanical heart-lung interaction. The two ventricles communicate in series and in parallel; each ventricle’s pressure-volume characteristics and loading conditions pulsate between systole and diastole. And around the heart and pericardium lies the respiratory pump – the lungs within the thorax – itself varying by pressure, volume and frequency. We shouldn’t be surprised, therefore, at the fallibility of distilling these exceedingly thorny relations into a simple output measurement [e.g. pulse pressure variation, vena cavae dimension change]; especially, if we desire an index which is universally applicable within the varied pathologies of the ICU. Accordingly, linking the physiologies of the cardiac and thoracic pumps will facilitate acquisition and interpretation of hemodynamic data as well as provide rationale for optimizing respiratory mechanics.
Respiratory Mechanics
Respiratory pressure-volume curves are oft-covered subjects in medical school, and have merit when analyzing clinically-important heart-lung interaction. The classic diagram, also known as the Rahn Diagram, depicts the static [i.e. in the absence of air flow], pressure-volume relationships of the lungs, chest wall and respiratory system [i.e. the lungs and chest wall together] [1, 2] - see figure 1.
Figure 1: Relationship between ‘Rahn Diagram’ and ‘Campbell Diagram.’ Cpulm is pulmonary compliance, Ccw is chest wall compliance, Crs is respiratory system compliance. The Crs is a ‘summation’ of the lung and chest wall in series; FRC is functional residual capacity
This diagram is similar to the Campbell diagram, which simply reflects the pulmonary pressure-volume relationship as a mirror image. Thus, the Rahn analysis is helpful when analyzing the patient passive with the ventilator [increase in airway pressure raising lung volume] while the Campbell diagram is better suited for patients breathing spontaneously [fall in airway pressure raising lung volume] [3].
For simplicity, the Rahn diagram will be considered herein – for the patient fully adapted with a ventilator on volume control.
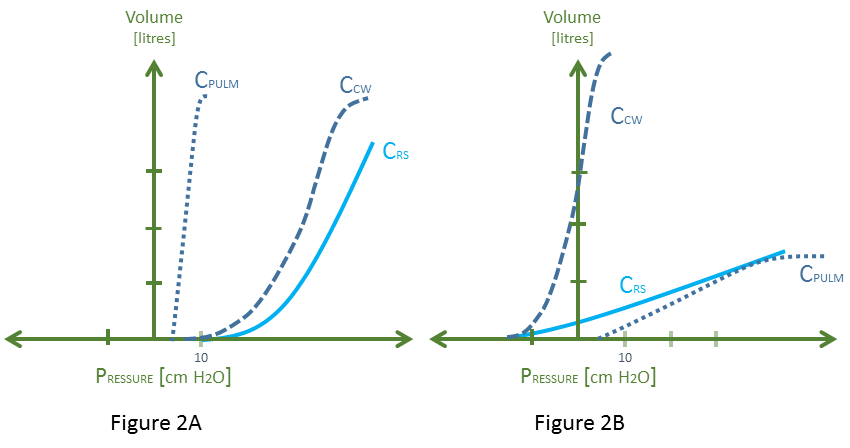
The slope of the respiratory system curve represents the compliance of the lungs and chest wall in series. For each point on the y-axis [i.e. volume applied], the pressure returned by the respiratory system is a summation of the respective recoil pressures of the passive lungs and chest wall individually. Thus, if the chest wall were to stiffen [e.g. obesity, ascites, intra-abdominal hypertension], its curve shifts down and rightwards and so too does the compliance curve of the respiratory system [4, 5]. Similarly, if the lungs lose compliance [e.g. massive aspiration, alveolar edema, fibrotic lung disease], its curve shifts down and rightwards and so too does the compliance curve of the entire respiratory system [5, 6] – see figure 2 A and B, respectively.
Figure 2: 2A demonstrates a system with normal Cpulm and abnormal Ccw and Crs. Note that the pathologies which stiffen the chest wall are varied and may change the slope of the Ccw [e.g. extra-pulmonary ARDS] or shift it rightwards without changing the slope [paralyzed obese chest wall [4]]. This diagram depicts both. 2B demonstrates abnormal pulmonary compliance; again the pathologies which do this are diverse and the down-shift of the curve is only a model depicting an increased pressure required to achieve a given lung volume [see concept of ‘baby lung’ [6]].
But what are the clinical correlates of these curves? The compliance curve of the respiratory system provides the static airway pressure of the respiratory system. On the ventilator, this is the plateau pressure [Pplat]. If one assumes that – during an end-inspiratory hold – there is a continuous column of air from the trachea to the alveolus, then the Pplat also represents the intra-alveolar pressure. Importantly, in the passive patient, the chest wall compliance curve tracks the pleural pressure [Ppl] – approximated by an esophageal balloon [7].
Accordingly, a high Pplat [low respiratory system compliance] may be of two very distinct etiologies [5]. If due to low lung compliance [with unchanged chest wall compliance], the Pplat will rise relative to the Ppl. If due to low chest wall compliance, the Pplat and Ppl will tend to rise in tandem.
Hidden Hemodynamics
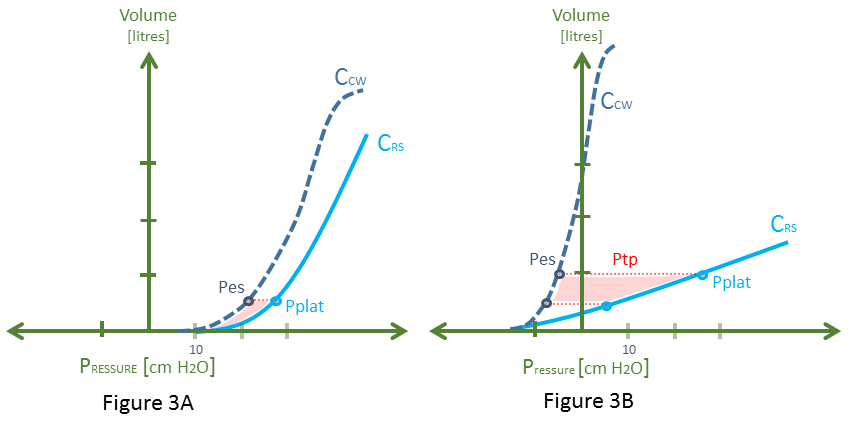
Wherein lie the hemodynamics on the Rahn diagram? Quietly nestled within this graphic sits markers of both right ventricular [RV] afterload and preload. Firstly, as above, if the Pplat represents the end-inspiratory alveolar pressure [PAlv] and the chest wall compliance curve illustrates the pleural pressure, then the lateral distance between these two points – for a given ventilator volume [on the y-axis] – depicts the trans-pulmonary pressure [Ptp]. The Ptp indicates the pressure across the alveolus and therefore the pulmonary capillary bed. The higher the Ptp, the greater the impedance to RV outflow through the pulmonary vascular tree [8]. Consequently, there should be a direct relationship connecting the area between the Crs and the Ccw curves [red shade] and RV afterload. A high RV afterload will drop the slope of the RV cardiac function curve; that is, lower its output for any given filling pressure.
Figure 3: This is a recapitulation of figure 2, with Cpulm removed for clarity. Pplat is plateau pressure and Pes is esophageal pressure as an estimate of pleural pressure [Ppl]. Each diagram assumes a starting PEEP of 5 cm H20 and a delivered breath of about 500 mL. While both scenarios have a nearly identical Pplat, note that in 3A, the difference between the Pplat and Pes [the transpulmonary pressure - Ptp] is low. Ptp is the distending pressure across the alveolus and pulmonary capillaries. Further, there is a higher Pes [Ppl] for this breath. In 3B, for the same breath, the Ptp is much greater, and the rise in Pes [Ppl] is much less.
Secondly, the degree to which the Ppl rises – in response to mechanical insufflation of the thorax – mediates RV preload. As such, a stiffened chest wall will increase Ppl for any given volume on the y-axis, dropping RV preload more impressively – see figure 3.
Implications for Practice
Thus, the clinician must recognize and balance the pre- and afterload effects exerted upon the RV by the respiratory pump [9]. Aim to minimize the area between the respiratory system compliance curve and the chest wall compliance curve; this should reduce Ptp and, ostensibly, RV afterload. Selective improvement in pulmonary compliance can achieve this goal. This can be done by minimizing alveolar edema, recruitment of atelectatic lung with PEEP [e.g. using the stress-index or driving pressure] or instituting the prone position. Importantly, application of PEEP and the prone position can diminish preload by raising Ppl and stiffening the chest wall, respectively [10].
Secondly, finding hemodynamic data within respiratory physiology explains the plethora of caveats found within the literature on fluid responsiveness. A large area between the chest wall compliance curve and respiratory system compliance curve will raise RV afterload throughout a breath. The result is an inspiratory-associated pulse-pressure variation due to afterload sensitivity – cor pulmonale physiology – rather than preload responsiveness [11]. Further, appreciating the relationship between volume delivered [y-axis], chest wall compliance and Ppl [on the x-axis] makes explicit the effect of respiratory mechanics on RV preload. It is established that altering the volume delivered to different degrees of chest wall stiffness can have shockingly different effects on Ppl, preload and, accordingly, hemodynamic variables [e.g. pulse-pressure variation] [12].
Finally, if the patient begins breathing spontaneously, the analysis becomes extraordinarily confounded and nearly impossible to apply in a clinically-meaningful way. We must then turn to assessments which raise venous return relative to RV function to assess fluid responsiveness [e.g. passive leg raise, end-expiratory occlusion test, etc.] [13].
Please check out other articles in this series,
Rahn, H., A.B. Otis, and et al., The pressure-volume diagram of the thorax and lung. Am J Physiol, 1946. 146(2): p. 161-78.
West, J.B., Challenges in teaching the mechanics of breathing to medical and graduate students. Advances in Physiology Education, 2008. 32(3): p. 177-184.
Banner, M.J., M.J. Jaeger, and R.R. Kirby, Components of the work of breathing and implications for monitoring ventilator-dependent patients. Crit Care Med, 1994. 22(3): p. 515-23.
Behazin, N., et al., Respiratory restriction and elevated pleural and esophageal pressures in morbid obesity. J Appl Physiol (1985), 2010. 108(1): p. 212-8.
Gattinoni, L., et al., Acute respiratory distress syndrome caused by pulmonary and extrapulmonary disease. Different syndromes? Am J Respir Crit Care Med, 1998. 158(1): p. 3-11.
Gattinoni, L. and A. Pesenti, The concept of "baby lung". Intensive Care Med, 2005. 31(6): p. 776-84.
Rodarte, J.R., et al., Chapter 2 - Lung and Chest Wall Mechanics, in Respiratory-Circulatory Interactions in Health and Disease2001, CRC Press. p. 9-32.
Vieillard-Baron, A., et al., Experts’ opinion on management of hemodynamics in ARDS patients: focus on the effects of mechanical ventilation. Intensive Care Med, 2016. 42(5): p. 739-749.
Jardin, F. and A. Vieillard-Baron, Right ventricular function and positive pressure ventilation in clinical practice: from hemodynamic subsets to respirator settings. Intensive Care Med, 2003. 29(9): p. 1426-34.
Jozwiak, M., et al., Beneficial hemodynamic effects of prone positioning in patients with acute respiratory distress syndrome. Am J Respir Crit Care Med, 2013. 188(12): p. 1428-33.
Magder, S., Further cautions for the use of ventilatory-induced changes in arterial pressures to predict volume responsiveness. Critical Care, 2010. 14(5).
Mesquida, J., H.K. Kim, and M.R. Pinsky, Effect of tidal volume, intrathoracic pressure, and cardiac contractility on variations in pulse pressure, stroke volume, and intrathoracic blood volume. Intensive Care Med, 2011. 37(10): p. 1672-9.
Monnet, X., et al., Passive leg-raising and end-expiratory occlusion tests perform better than pulse pressure variation in patients with low respiratory system compliance. Crit Care Med, 2012. 40(1): p. 152-7.


