

ICU Physiology in 1000 Words: Driving Pressure & Stress Index

By Jon-Emile S. Kenny [@heart_lung]
The problem with the lung in the acute respiratory distress syndrome [ARDS] is not that it is stiff, but rather, that it is small [1]. In the 1980s, CT scans of the lungs of patients with ARDS revealed that the functional lung was attenuated in size and that dependent densities formed [2]. These images led to the notion of the ‘baby lung’ as the size of aerated lung in ARDS patients approximated the size of a child’s lung. Appropriately, the degree of dependent consolidation correlates with shunt fraction, degree of hypoxemia and pulmonary hypertension [3].
However, in any given patient, it is difficult to predict the exact size of the ‘baby lung.’ Regardless, the aforementioned physiology provides strong rationale for the notion of smaller tidal volume or ‘lung protective’ ventilation. The larger the mismatch between the size of the ventilator-delivered volume and the size of the ‘baby lung,’ the larger the difference in airway pressure. As somewhat of an analogy, consider two balloons comprised of the same elastic material [i.e. their specific elastances are equivalent], but one has a capacity of 100 mL and the other a capacity of 500 mL. Delivery of a 500 mL breath to each of these balloons will result in a different stress across the balloon [i.e. the distending pressure] and different strain [i.e. the increase in balloon volume relative to its resting size]. In the intubated patient [free of respiratory effort], this physiology is represented by a calculated difference in respiratory system compliance [Crs]; that is, for a given change in thoracic [lung and chest wall] volume, there is a difference in measured airway pressure.
Given the above, a complex statistical analysis of previously published randomized controlled trials on tidal volume [Vt] limitation and positive end-expiratory pressure [PEEP] in ARDS patients was undertaken [4]. The authors hypothesized that the change in airway pressure in response to a volume-limited ventilator-delivered breath would be the best physiological surrogate for assessing the stress and strain of the ‘baby lung.’ The driving pressure [ΔP] is equal to [equation 1]:
The driving pressure is equal to the end-inspiratory plateau pressure [Pplat] minus the positive end expiratory pressure [PEEP], such that [equation 2]:
Contemplating this equation can certainly cause some mathematical consternation because it is confusing as to what the independent [clinician-controlled] and dependent [system output] variables are. For this, an illustration may prove fruitful [diagram 1].
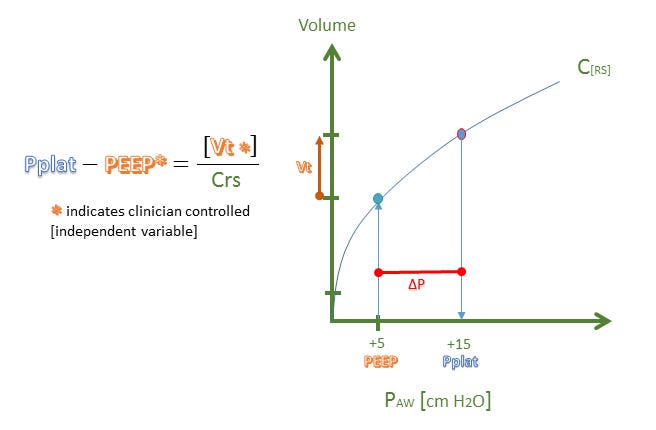
Diagram 1: ΔP = driving pressure, Paw = airway pressure, Pplat = plateau pressure, Crs = respiratory system compliance, Vt = tidal volume
From diagram 1, it can be seen that there are two independent variables, the Vt [or ΔV] and the PEEP as these are both selected by the clinician in a volume-limited mode of ventilation. Consequently, the true dependent variable is the Pplat while the Crs is a derived variable that forms the slope of the ΔV/ΔP relationship.
The first complicating matter here is that changes in both Vt and PEEP by the clinician can change the Crs [the slope of the line] – if a change in ventilator setting [e.g. an increase in PEEP] results in over-distension, the slope of the Crs will bend down and rightwards [diagram 2, curve A], while if there is recruitment, the slope of the Crs will bend up and leftwards [diagram 2, curve B]. As Crs can co-vary, it may confound what a change in Pplat [and therefore ΔP] represents. This, in my opinion, may make it difficult to design a trial that provides the clinician with a universal target value for ΔP. Nevertheless, it can be inferred that if ΔP remains the same, or falls, it likely represents a ‘baby lung’ that is not overly stressed by a change in ventilator setting.
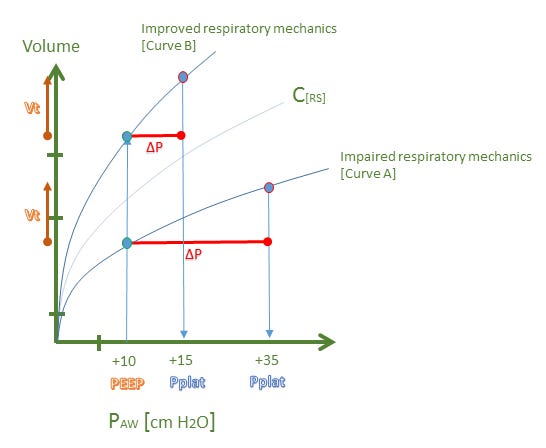
Diagram 2: Note, tidal volume [Vt] remains the same for both curve A and curve B
The second complicating matter here is that Crs reflects the pressure difference between the alveolus and the atmosphere, that is, the distending pressure across the thorax. But this does not represent the true stress on the lung which is the trans-pulmonary pressure [Ptp] or the alveolar pressure minus the pleural pressure [2, 5]. Accordingly, a patient with normal pulmonary compliance, but a very low chest wall compliance [e.g. obesity, extra-pulmonary ARDS, ascites] will have a large ΔP [curve A above], but without a large stress across the lung [6, 7]. This is important, because it is the stress and strain on the lung which places the patient at risk for lung injury and is also an important determinant of right ventricular hemodynamics [2, 8]. This criticism was astutely raised in response to the original paper with the suggestion of measuring esophageal pressure as a surrogate for pleural pressure [9]. The authors responded, somewhat anemically, with the following “…the measurement of esophageal pressures would just reveal a fixed elastic component (chest wall), in series with lung elastance,” which lacks substance, because this is true for all patients who are passive with a mechanical ventilator. The question posed to the authors is distinguishing how much of the chest wall elastance contributes to the calculated airway pressure. The effect of the chest wall on airway pressure can be clinically very significant [10, 11].
One method for qualitatively evaluating respiratory mechanics – which flows from the physiology above – is the stress index [12]. If examination of the terminal portion of the pressure-time curve on the ventilator [again, in a volume-cycled mode of ventilation] demonstrates curvature away from the pressure axis [which approximates curve B above] there is said to be a stress index < 1 or tidal recruitment. By contrast, if the terminal portion of the pressure-time curve bends towards the pressure axis on the ventilator, curve A above is approximated, and represents tidal over-distension [stress index > 1]. Note that on the ventilator, pressure is on the y-axis, not on the x-axis as above. Also on the ventilator, time in on the x-axis rather than volume. The absolutely crucial point here is that when measuring the stress index, flow must be constant [square wave delivery] as when flow is constant, volume and time become linear analogs [13]. In other words, flow must be constant so that deformations of the pressure curve reflects alteration in the elastic properties of the lung rather than demonstrating changes in flow.
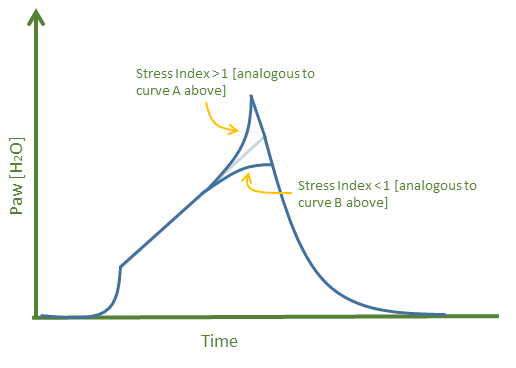
Diagram 3: cartoon of ventilator pressure-time waveform
For more information please watch the following lectures [1D, 1E, and 4D]
References:
Gattinoni, L., et al., The "baby lung" became an adult. Intensive Care Med, 2016.
Gattinoni, L. and A. Pesenti, The concept of "baby lung". Intensive Care Med, 2005. 31(6): p. 776-84.
Gattinoni, L., et al., Inflammatory pulmonary edema and positive end-expiratory pressure: correlations between imaging and physiologic studies. J Thorac Imaging, 1988. 3(3): p. 59-64.
Amato, M.B., et al., Driving pressure and survival in the acute respiratory distress syndrome. N Engl J Med, 2015. 372(8): p. 747-55.
Akoumianaki, E., et al., The application of esophageal pressure measurement in patients with respiratory failure. Am J Respir Crit Care Med, 2014. 189(5): p. 520-31.
Gattinoni, L., et al., Acute respiratory distress syndrome caused by pulmonary and extrapulmonary disease. Different syndromes? Am J Respir Crit Care Med, 1998. 158(1): p. 3-11.
Gattinoni, L., et al., Bench-to-bedside review: chest wall elastance in acute lung injury/acute respiratory distress syndrome patients. Crit Care, 2004. 8(5): p. 350-5.
Jardin, F. and A. Vieillard-Baron, Right ventricular function and positive pressure ventilation in clinical practice: from hemodynamic subsets to respirator settings. Intensive Care Med, 2003. 29(9): p. 1426-34.
Costa, E.L., A.S. Slutsky, and M.B. Amato, Driving pressure as a key ventilation variable. N Engl J Med, 2015. 372(21): p. 2072.
Talmor, D., et al., Mechanical ventilation guided by esophageal pressure in acute lung injury. N Engl J Med, 2008. 359(20): p. 2095-104.
Brochard, L., Measurement of esophageal pressure at bedside: pros and cons. Curr Opin Crit Care, 2014. 20(1): p. 39-46.
Grasso, S., et al., Airway pressure-time curve profile (stress index) detects tidal recruitment/hyperinflation in experimental acute lung injury. Crit Care Med, 2004. 32(4): p. 1018-27.
Bekos, V. and J.J. Marini, Monitoring the mechanically ventilated patient. Crit Care Clin, 2007. 23(3): p. 575-611.