

ICU Physiology in 1000 Words: The Geometry of Venous Congestion

Jon-Emile S. Kenny MD [@heart_lung]
In another world – of many – at another time, travelling at a different velocity, when I embraced Schrodinger’s equation as epistemology rather than ontology, we considered veno-cardiac coupling. The geometry of ejection fraction! With distance and time and Fourier transformations spinning me between position and momentum, readings, writings, flights, airline lounges, status this, status that – a wave function collapses, but only when I take a measurement of things. A superposition emerges, like Schrodinger’s cat in a box: veno-cardiac coupling, geometry, Guyton and venous congestion? This observation – prompted by a recent investigation of portal vein pulsatility, mean systemic pressure analogue and right ventricular function [1] – may leave us dismayed, but less so – I promise – than the outcome triggered by Schrodinger’s Geiger counter and poison hammer.
Measurements
Within 6 hours following open heart surgery, Balan and colleagues studied the relationship between the mean systemic pressure analogue [Pmsa], echocardiographic measures of right ventricular [RV] function and the portal vein pulsatility index [i.e., the PVPI as a measure of venous congestion] in 55, ‘fluid tolerant’ patients with signs of peripheral hypo-perfusion [1]. Here, fluid tolerance was ascribed when the PVPI was < 50%. In other words, patients were included in this study if the PVPI was consistent with low venous congestion.
All patients received a passive leg raise [PLR] to determine preload responsiveness [PR], defined as an increase in the left ventricular outflow tract velocity time integral of at least 12%; PR patients then received a bolus of lactated ringers [LR] [see Figure 1A].
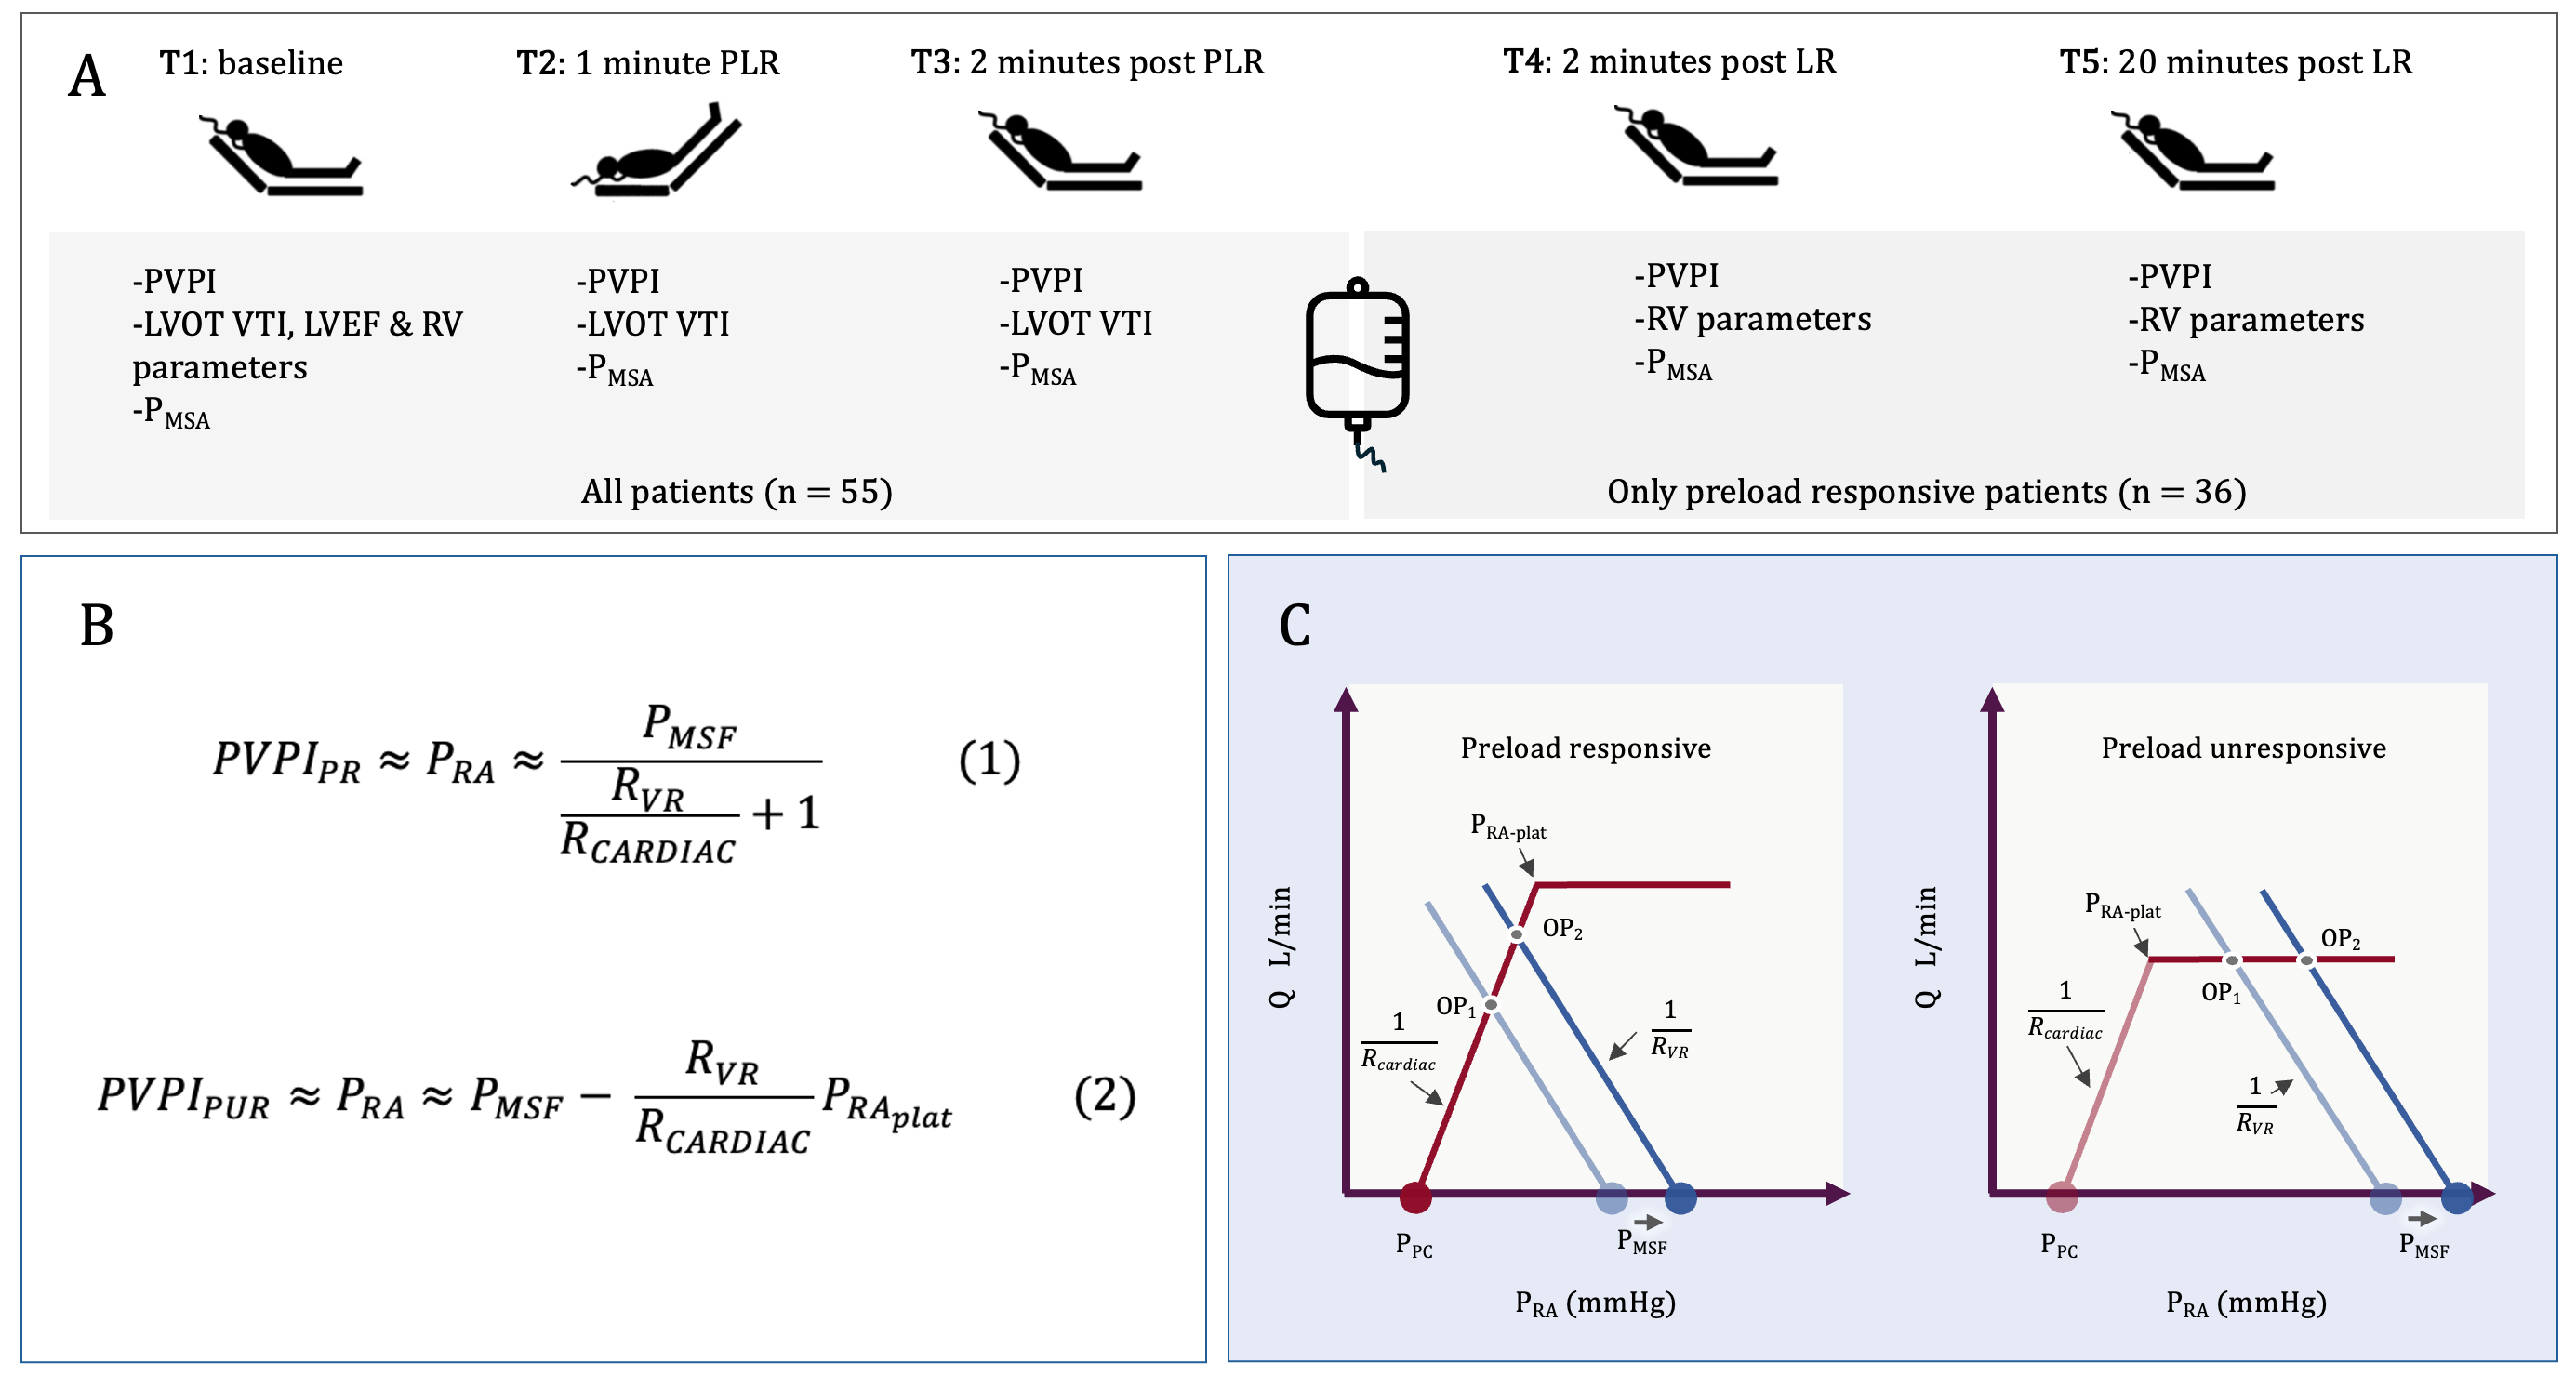
Figure 1. A.] Five time points were studied [T1-T5] with T1-T3 being before, during and after the PLR; T4 and T5 were immediately after and 20-minutes following the LR infusion, respectively; thus, only fluid responsive patients had measures at T4 and T5. PVPI and Pmsa were recorded at each time point, while assessments of RV function occurred only at T1 [all patients] and T4 and T5 [fluid responsive patients following LR]. The echocardiographic measures of RV function at T1, T4 and T5 were RV to LV end-diastolic are ratio [RVEDA/LVEDA], tricuspid lateral annular systolic velocity [RV S’], RV fractional area change [RVFAC], pulmonary acceleration time [PAT] and right myocardial performance index [RIMP]. B.] The equations from the Geometrical model for PVPI in preload responsive patients [equation 1] and unresponsive patients [equation 2]. C.] Graphical representation of the Geometrical model. See also [2-4].
Associations
And what measures associated with PVPI, the surrogate of venous congestion? At baseline [T1], only RV function did [i.e. the RVEDA/LVEDA, RIMP and RV S’] while Pmsa did not. However, for all patients across T1-T3 [i.e., before, during and after the PLR], there was a direct and significant association between PVPI and Pmsa. Similar results were seen in the fluid responsive patients at T1, T4 and T5. Therefore, in a static sense [i.e., at baseline], Pmsa as a surrogate of ‘volume state’ was not related to PVPI, but in a dynamic sense it did – change in Pmsa and PVPI were positively correlated.
The Geometrical Model
How do we make sense of these data? One approach is the Geometrical model of the circulation [3, 4], which argues – as Guyton did – that right atrial pressure [i.e., ‘congestion’] is a dependent variable determined by other, independent variables of the circulation. What then determines right atrial pressure [Pra] in the Geometrical model?
In an accompanying letter [2], it is argued that the trans-mural right atrial pressure [i.e., the pressure across the wall of the right atrium] is the primary – though not solitary – determinant of PVPI. It is also shown, through simple geometrical approximations, that the PVPI is 1.] directly related to Pmsa and 2.] indirectly related to the ratio of the slope of the venous return curve [Rvr] to the cardiac function curve [Rcardiac]; the Rvr/Rcardiac is ‘veno-cardiac coupling.’ [Figure 1B]
Importantly, Rvr, as initially formulated by Guyton, includes the resistance and compliance of both the arterial and venous circulations, and the relative distribution of blood flow within them [4-6]; therefore, cardiac function [Rcardiac] interacts with peripheral vascular characteristics [Rvr] to determine how far below the Pmsa the Pra settles. Low Rvr [e.g., veno/vasodilation and distribution through fast time constant vascular beds] coupled with poor cardiac function [i.e., high Rcardiac] means that Pra falls out near the Pmsa. High Rvr with great cardiac function [i.e., low Rcardiac] means that the Pra will distance itself from the Pmsa [Figure 1C].
This formulation helps explain why, at T1, PVPI did not strongly association with Pmsa, increased or decreased Rvr/Rcardiac ratios between patients will move the Pra away from and towards the Pmsa, respectively. Another reason why association was less strong at T1 is considered briefly below.
Clinical Implications
At the bedside, testing for PR versus preload unresponsiveness [PUR] gives additional information. This is because in the Geometrical model, being PR versus PUR modifies the relationship between Pra [i.e., PVPI], Pmsa and the Rvr/Rcardiac ratio [2]. In PR patients, the Rvr/Rcardiac ratio is the multiplicative inverse of Pra while in PUR patients the ratio is the arithmetic inverse [Figure 1B]. Therefore, changes in Pmsa have a mathematically greater effect on Pra when the patient is PUR. As above, because at T1, there was a mixture of PR and PUR patients, the relationship between PVPI and Pmsa is less linear as a function of the proportion of PUR-to-PR patients.
Second, the Geometrical model explains dissociation between measures of venous congestion and preload responsiveness. For example, why patients can have no venous congestion and be PUR [e.g., in this study 35% of patients with a PVPI < 50% were PUR] or how patients can have venous congestion and yet remain PR [7-9]. PR in the Geometrical model depends upon the relationship between the Pra and the right atrial pressure at which the cardiac function forms its plateau [i.e., the Pra-plat, Figure 1C]. If the Pra-plat is a low value [e.g., less than 5 mmHg], then a patient would be PUR with a Pra as low as 5 mmHg. Conversely, if the Pra-plat is high [e.g., more than 15 mmHg], then a patient could have a Pra up to 13 or 14 mmHg and remain PR. Accordingly, it is entirely expected that measures of venous decongestion will be seen with preload unresponsiveness and measures of venous congestion with preload responsiveness!
Finally, when there is a state of venous congestion, reducing the Pmsa with diuresis or renal replacement therapy will have differential impacts on PVPI depending on whether the patient is PR or PUR. Volume removal will have less decongestive effects in patients who are PR, because of the mathematical relationship described above [Figure 1B]. On the other hand, volume removal in a patient who is PUR will have greater decongestive effects, until the Pra is reduced below the Pra-plat [Figure 1C]. These predictions have been generally observed when guiding volume removal by passive leg raise testing [10, 11].
Best,
JE
Dr. Kenny is the co-founder and Chief Medical Officer of Flosonics Medical in Toronto, Ontario Canada. He also the creator and author of a free hemodynamic curriculum at heart-lung.org. Download his free textbook here and check out the remainder of this series.
References
1. Balan C, Morosanu B, Fodoroiu A, Dobre V, Dumitrache A, Barbulescu RT, Valeanu L, Robu C, Boros C, Nica A et al: Decoding portal vein pulsatility: hemodynamic determinants in a post-hoc analysis of a prospective observational trial. Annals of Intensive Care 2025, 15(1):81.
2. Kenny JS, Werner Moller P: Venous congestion and the geometry of Guyton. Ann Intensive Care 2025, 15(1):166.
3. Kenny J-ES, Werner Moller P: The meaning of volume responsiveness and its relationship to venous return. American Journal of Physiology-Heart and Circulatory Physiology 2023, 325(6):H1461-H1462.
4. Kenny J-ES: A framework for heart-lung interaction and its application to prone position in the acute respiratory distress syndrome. Frontiers in Physiology 2023, 14.
5. Jacobsohn E, Chorn R, O’Connor M: The role of the vasculature in regulating venous return and cardiac output: historical and graphical approach. Can J Anaesth 1997, 44(8):849-867.
6. Magder S: Volume and its relationship to cardiac output and venous return. Crit Care 2016, 20(1):271.
7. Muñoz F, Born P, Bruna M, Ulloa R, González C, Philp V, Mondaca R, Blanco JP, Valenzuela ED, Retamal J et al: Coexistence of a fluid responsive state and venous congestion signals in critically ill patients: a multicenter observational proof-of-concept study. Crit Care 2024, 28(1):52.
8. Kenny J-ES: Passive leg raising uncovers venous congestion: dynamic fluid intolerance and the Doppler Starling curve. Critical Care 2024, 28(1):388.
9. Kenny J-ES, Prager R, Haycock K: The elusive relationship between cardiac filling and fluid responsiveness. Critical Care 2024, 28(1):83.
10. Castro R, Born P, Roessler E, Labra C, McNab P, Bravo S, Soto D, Kattan E, Hernández G, Bakker J: Preload responsiveness-guided fluid removal in mechanically ventilated patients with fluid overload: A comprehensive clinical-physiological study. J Crit Care 2024, 84:154901.
11. Monnet X, Cipriani F, Camous L, Sentenac P, Dres M, Krastinova E, Anguel N, Richard C, Teboul JL: The passive leg raising test to guide fluid removal in critically ill patients. Ann Intensive Care 2016, 6(1):46.
not helpful at all
Agree difficult to follow and with unclear clinical implications